S.Meters
S.Meter Types And Use.
Mar
While constructing a ham radio transceiver, a receiver, or a transceiver, the need is felt to use a S-Meter to
indicate the signal strength of the radio station being heard in our receiver or transceiver.
The need also arises for several reasons.
1. The most important reason to use a s.meter is that when one has QSO with another ham radio operator who may have a similar or different radio equipment , you need to share the signal strength report; it’s only then that the stations know how their signal is being heard on the other side.
There are various types of S-Meter circuits that can be used. They can be of various type to read the signal strength.
1. An analog VU type meter that has a dB gain marked as a parameter for measuring the signal.
strength.
2. A row of LEDs This type of meter can be considered a fancy type of meter, but in actual
sense, it may not reflect the correct strength of the signal being received.
The first type is the analog meter, which is a physical meter with a needle that moves across a
scale to indicate signal strength. Analog meters are typically found on older radios and have
been largely replaced by digital S-meters in modern equipment.
The second type is the digital S-meter, which displays signal strength using a numeric value.
and/or a bar graph display. Digital S-meters are commonly found on modern radios and
transceivers and can display more precise measurements than analog meters.
Additionally, some radios and transceivers may have additional types of S-meters, such as
peak-reading or average-reading S-meters, which provide information about the strength of the
signal over time. These meters are typically used by operators to adjust their equipment for
optimal performance.
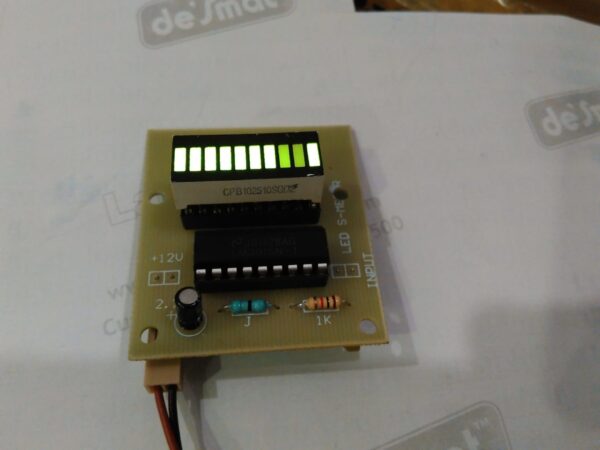
3. Bar Graph S-Meter
An LED bar graph is a type of visual display that uses a series of light-emitting diodes (LEDs).
to indicate the strength of a signal received by a receiver.
The LED bar graph is typically connected to the receiver’s output and is designed to respond to
changes in signal strength. When the signal is weak, fewer LEDs light up, and when the signal is
is strong, more LEDs light up.
The LED bar graph works by using a circuit that compares the strength of the received signal to
a set of reference levels. The circuit then activates the appropriate number of LEDs based on
the strength of the signal, which creates a visual indication of the signal strength.
In summary, the LED bar graph serves as a simple visual tool that allows the user to quickly
and easily monitor the strength of a signal received by a receiver.
The bar graph meter looks quite attractive and comes in a variety of colors.
We at amateurradiokits.in have made a low-cost kit that can be used as a bar graph meter.
Link to purchase the bar graph led.